Market Indicators: Beginners Guide To Why The Stock Market Goes Up And Down

Do you find yourself asking the question “why is the stock market down today?” You’re not alone. It’s one of the key questions asked daily. Yet, maybe its time to find out how that question is answered with our beginner’s guide to market indicators.
CHECK OUT: The future Snowflake IPO that’s getting tech stock investors hot under the collar.
How the market is decided as up or down?
The way markets are determined as up or down is simple:
- Breadth: Across the market or per individual sector (tech, pharma, etc.) indicators identify if a stock is up or down against an earlier value.
- If more stocks are up than down, the market or sector is up.
- Sentiment: Along with breadth, other market indicators use stock volume to determine demand (bearish and bullish sentiment).
- If more stocks are bearish than bullish, the market sentiment is bearish.
In both scenarios, more stocks leaning one way than the other determines the answer to your “why is the stock market down today” question.
Market indicators determine how data is understood. However, just because the market is down or bearish, doesn’t mean there isn’t an investment opportunity. Just as, an up and bullish market doesn’t make investment less risky.
Understand the market indicators, look at the data, and research before making any investment.
CHECK OUT: The risks of short term trading and understanding whether it is right for you?
What are market indicators?
Market indicators are defined by market indicator tools.
- Have you ever heard the term “the market is getting frothy?” No doubt you have. This term is based on when market indicators have pointed out that there are many new highs. This market indicator is called New Highs-New Lows and also leads to the famous term, “the market is bottoming out.” Which is said if the market indicator is identifying many new lows.
- Some market indicator tools simply soften data and make them more digestible by creating smooth lines rather than screens full of numbers. One indicator tool called the McClellan Oscillator uses a data-range to put market breadth into context.
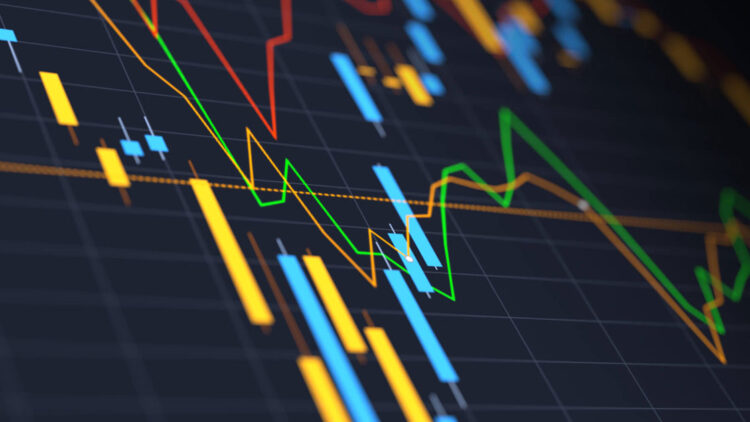
- One of the most popular methods of visualizing data is through Moving Averages. A lot of market indicator tools use this method because it allows a clean look at stocks movement compared to averaged accumulated historic data.
It sounds super-complicated but we guarantee if you’re using a trading app you’ve encountered many of these market indicator tools already.
Go on, load up your preferred app and look at all the tools and ways you can define how the market is shown to you in graphs. Those lines help you identify aspects of the market – which is the purpose of a market indicator tool.
What events make stock values change?
We’ve covered the market indicators and tools used to determine if a market is up or down, bullish or bearish. Now it is time for the events to watch out for that change the direction of stocks.
- Corporate or government performance data
- Breaking news about corporate espionage and wrong-doings.
- Wars and conflicts
- Changes in technology or market demands
- Government policies
- Inflation and deflation
- Natural disasters
All the above reasons make investing risky, but ultimately worth it when you pick right.
CHECK OUT: Five steps to picking stocks if you’re an stock market virgin.